SUCCESS STORY
Cut manufacturing costs & optimise resources
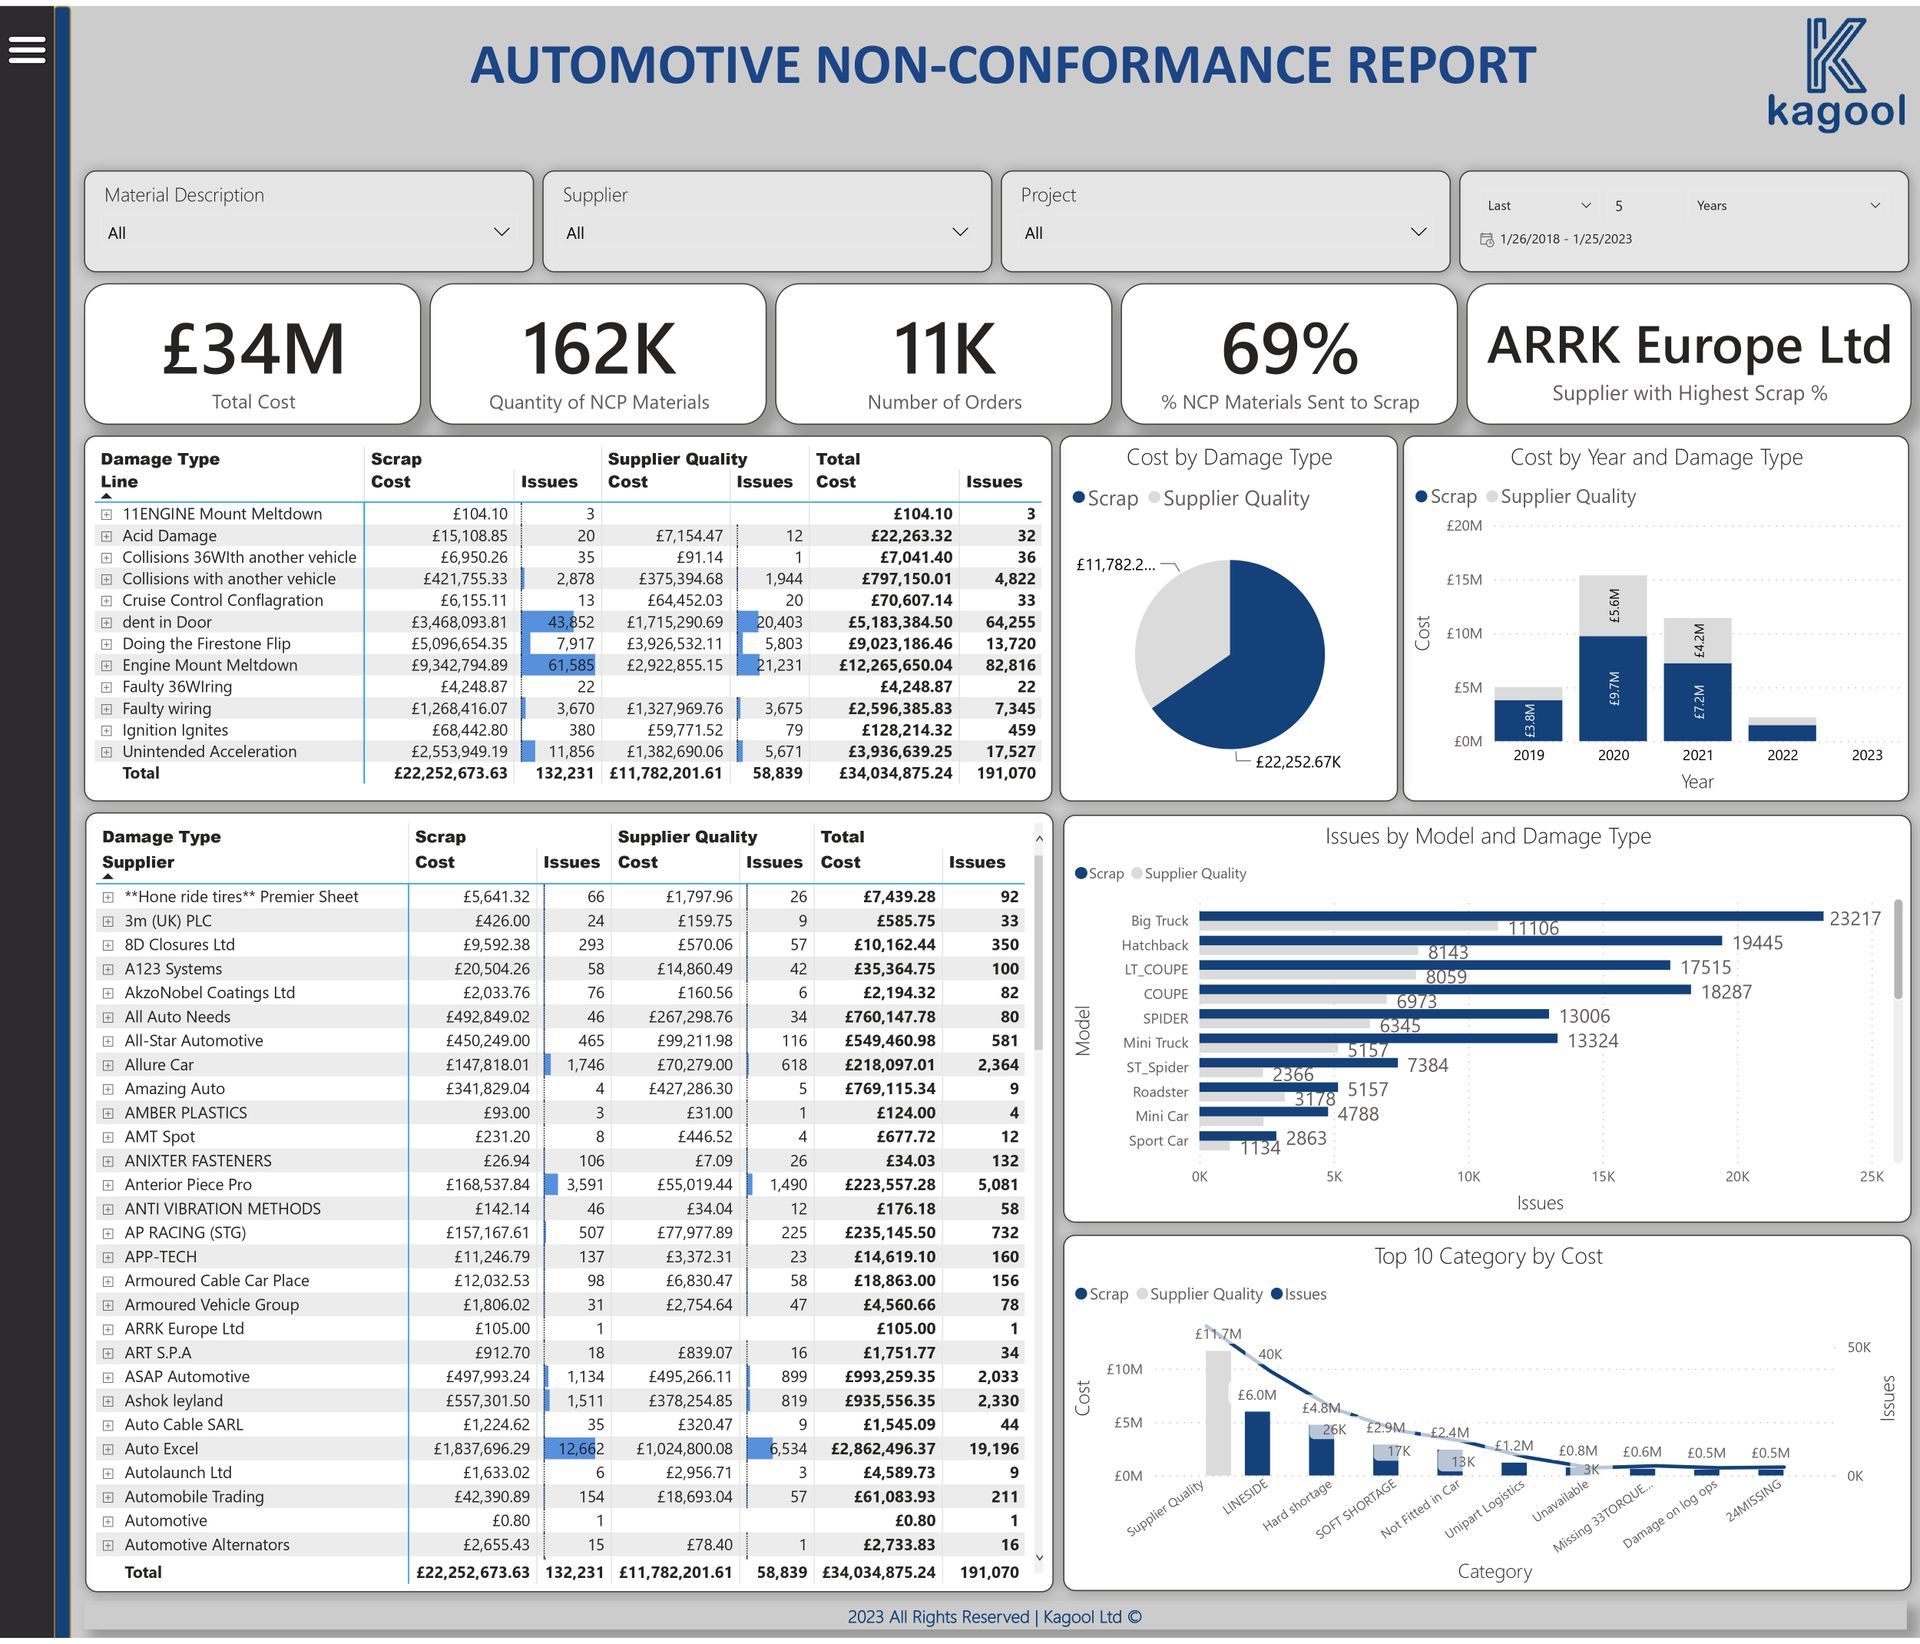
Kagool created Power BI reports to display the client's SAP data on defective parts, giving insights in near real-time on the costs, frequency and suppliers of each defect. The client can now make data-driven decisions on how many parts to order, and which defective parts or suppliers are most expensive or disruptive, needing priority attention to fix.
These insights have enabled the client to optimise resource utilisation and save manufacturing costs.
About the Client
The client is a globally renowned high-performance sports car business. They have been pioneering and innovating in the competitive world of Formula 1 for decades, and have won multiple World Championships.
The Vision
The client aspires to create a culture of data-driven innovation, backed by easy access to interactive analytics dashboards in real-time.
The start of their digital transformation journey is focused on making better decisions based on non-conforming parts data. Business insights from this data will enable effective decisions such as the right quantities to order to minimise wastage while avoiding stock outages. The client will also gain insights on any parts shown to be consistently faulty, allowing them to target and investigate any issues.
In order to gain relevant business intelligence on non-conforming parts, the client requires their SAP data to be accurate and up-to-date. The data should serve accessible and interactive analytics dashboards in near real-time.
The solution needs to be readily scalable and adaptable for future business growth.
Our Solution
The client chose Microsoft Azure as their new intelligent data platform, and was introduced to Kagool for our combination of expertise and products which together enable SAP-based big data analytics in Azure and Power BI.
Kagool started with a Proof of Value, using our product Velocity to move the client's SAP data into the Azure Data Lake, with limited impact on SAP resources. This provides a Single Source of Truth for their business data, ensuring analytics will be based on accurate, consistent and up-to-date information.
We created interactive Power BI analytics dashboards to display key metrics about non-conforming parts in near real-time. The report provides information related to the type of defects for the various parts, including:
- type of defect
- scrap reason
- cost incurred for the reach of the defects
- occurrence of the defect in a time frame
The information can be viewed with regard to the version of the final product, the damage type, and the percentage of non-conforming parts with 'Supplier Quality' as the reason for the defect.

Outcomes
The client will be able to make data-driven decisions to optimise resource utilisation and maximise cost-effectiveness. They can quickly identify the defects that occur most frequently, or incur higher costs to resolve, and prioritise these to identify the root cause and achieve a permanent resolution.
After a successful Proof of Value, the client has continued their partnership with Kagool to implement the intelligent data platform and Power BI reporting across the business.
This solution provides a future-proof data platform as a foundation for their digital transformation strategy. Azure is ready and adaptable for future innovations, including these planned projects:
- Building more analytics dashboards, e.g. for inventory management
- Application for software diagnostics
- Internet of Things integrations to enable analysis of telemetry data from development cars to improve products for customers
- Predictive analytics powered by Artificial Intelligence (AI)
Benefits
Efficient manufacturing
Data-driven decisions to optimise resource utilisation and maximise cost-effectiveness
Rapid time to value
Kagool offers a swift implementation schedule delivering rapid time to value
Adaptable platform
Data platform is scalable and adaptable for future growth, saving future costs by avoiding future infrastructure changes


