How to Use MuleSoft's Anypoint Functional Monitoring for APIs
APIs create exchange of information, but they also create vulnerabilities. This means tracking the availability and performance of APIs is very important.
This step-by-step guide shows how to use MuleSoft's Anypoint Functional Monitoring to effectively monitor the performance of your APIs.
The Anypoint Functional Monitoring solution enables developers and operators to perform consistent testing of the functional behaviour and performance of their APIs. This can be done throughout the API lifecycle, in testing and production environments.
Anypoint Functional Monitoring keeps track of the health of public and private APIs that are being used in application networks to ensure the applications are integrated correctly, with appropriate alerts set up to warn the developers in case of a failure.
Anypoint Functional Monitoring can address the following questions:
- Are APIs available and running?
- Is the data collected through API monitoring relevant for performance analysis?
- Are the appropriate alerts set up to warn developers about issues?
You monitor APIs by accessing the Functional Monitoring section of Management Center, from the home page of Anypoint Platform.
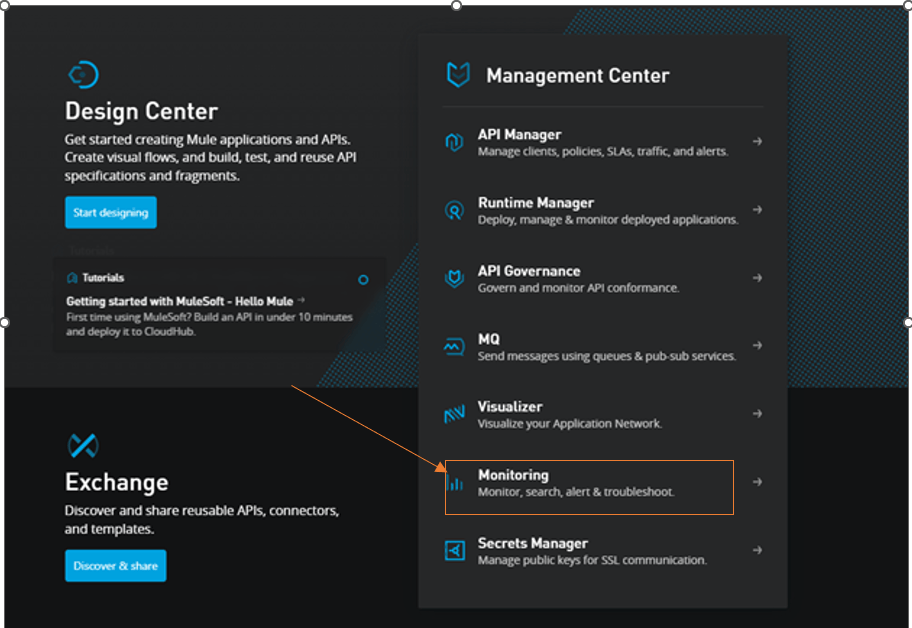
How to set up a Monitor
- Click on Create a Monitor in the Functional Monitoring section of Anypoint platform.
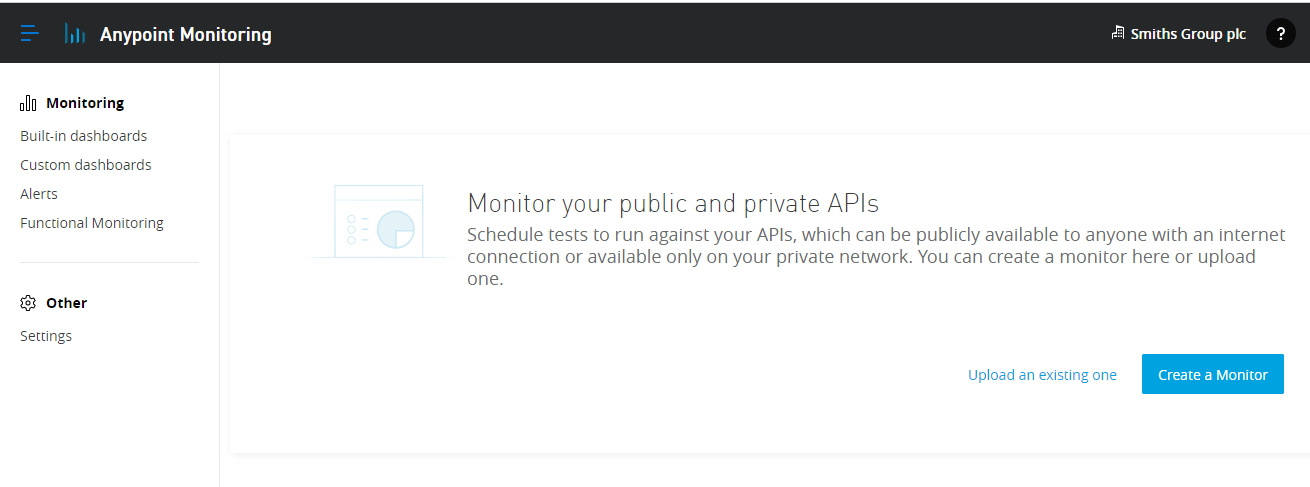
There are three steps to create a Monitor.
- Set up the Monitor
- Select Endpoints
- Set Notifications
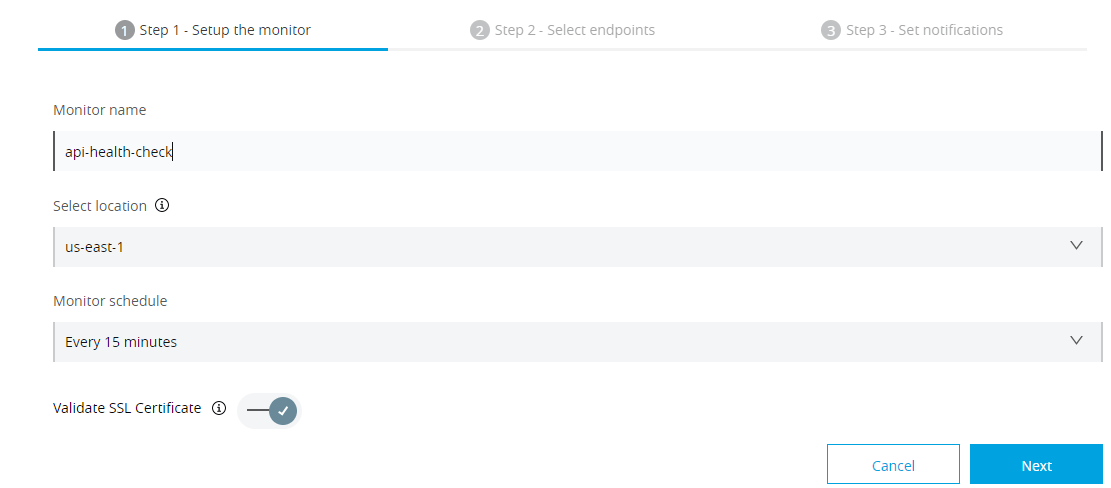
Step 1: Set up the Monitor
Give the monitor a specific name, select the location and schedule the time for the Monitor to run. Toggle the Validate SSL Certificate to specify if the monitor needs to use self-signed certifications. Then click Next, as shown in the picture below.
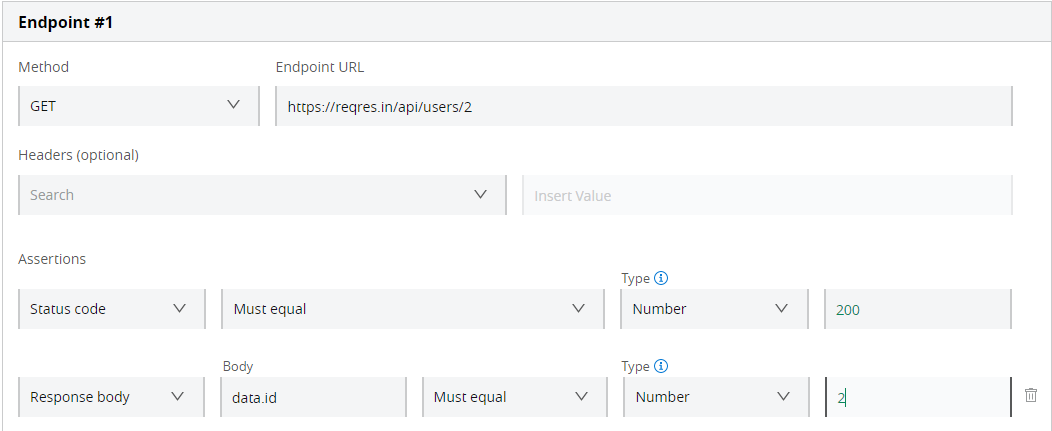
Step 2: Select Endpoints
We need to specify the API we want to test by providing the API’s Endpoint URL along with its http method, optional Headers and give Assertions to verify the response. Multiple assertions can also be added to validate the response. The Assertions could be Status code, Response header and Response body. You can also preview the test by clicking Run now under preview the result of your monitor. Then, click on Next.

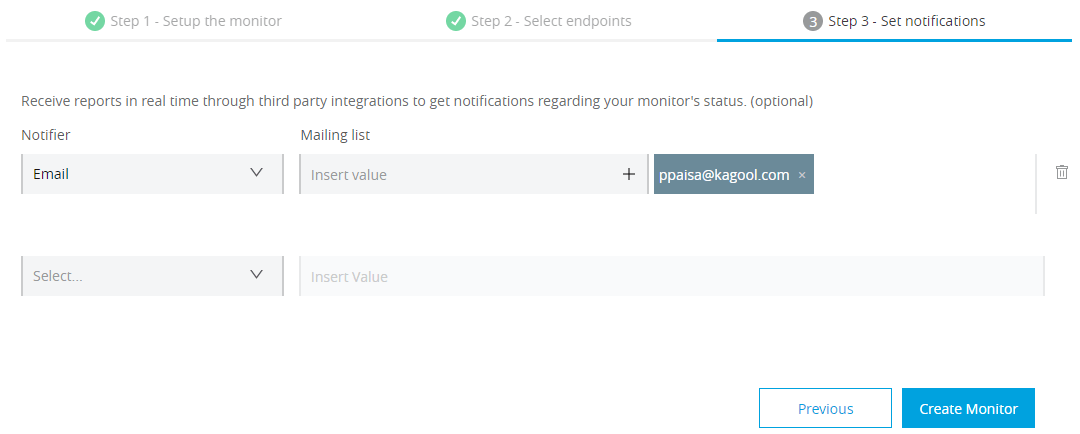
Step 3: Set notifications
We can configure a notification alert via an Email, Sumologic etc. Then, click on Create Monitor.
After successfully creating a Monitor, the monitor detail’s view appears, where the bar graph shows the daily average response time of all the tests scheduled.
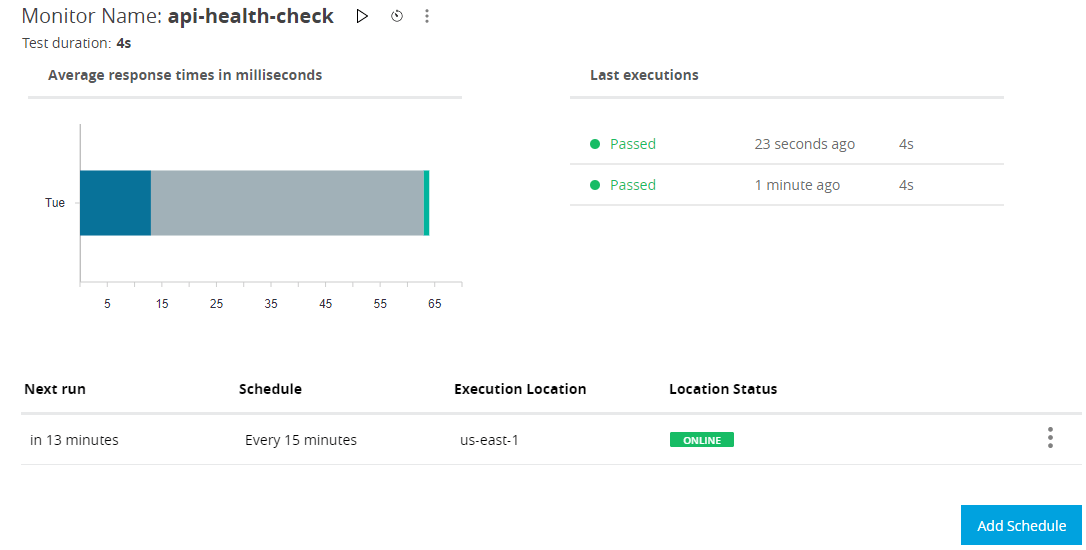
Monitor details view also have the following actions:
- Click ▷ to immediately execute a Monitor.
- Click on Edit Monitor to modify a Monitor.
- Click on Delete Monitor to delete a Monitor.
- Click on the clock symbol to view Monitor History.
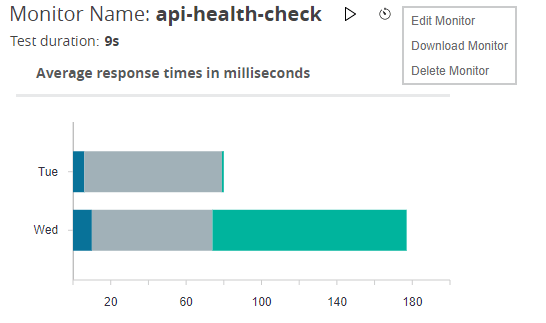
Monitor History:

If the Scheduler test run fails or if any issue exists with the API’s performance, an email alert will be sent to the Configured email.
Notification email received for a test failure scenario:
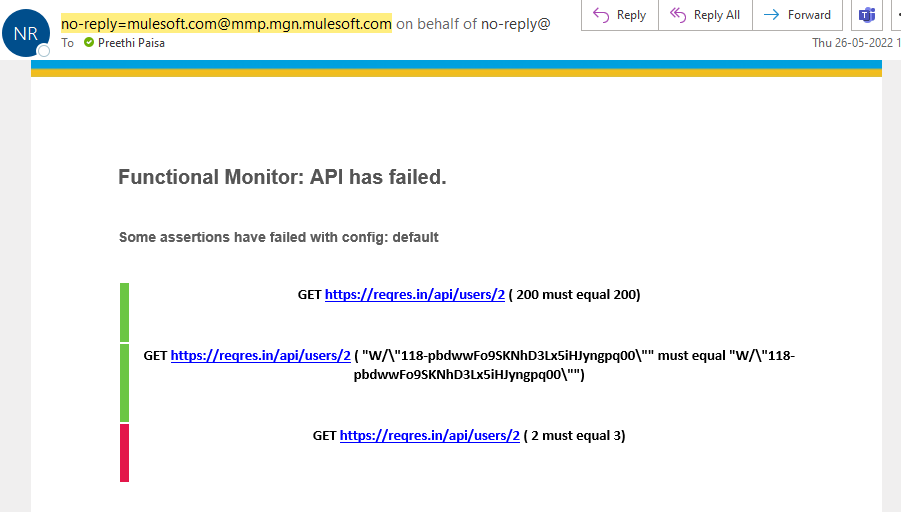
These alerts ensure you are always kept up to date on any issues, so you can resolve them quickly.


