

How can you use DAX to make the most of Power BI and make effective data-driven decisions?
What is a dashboard?
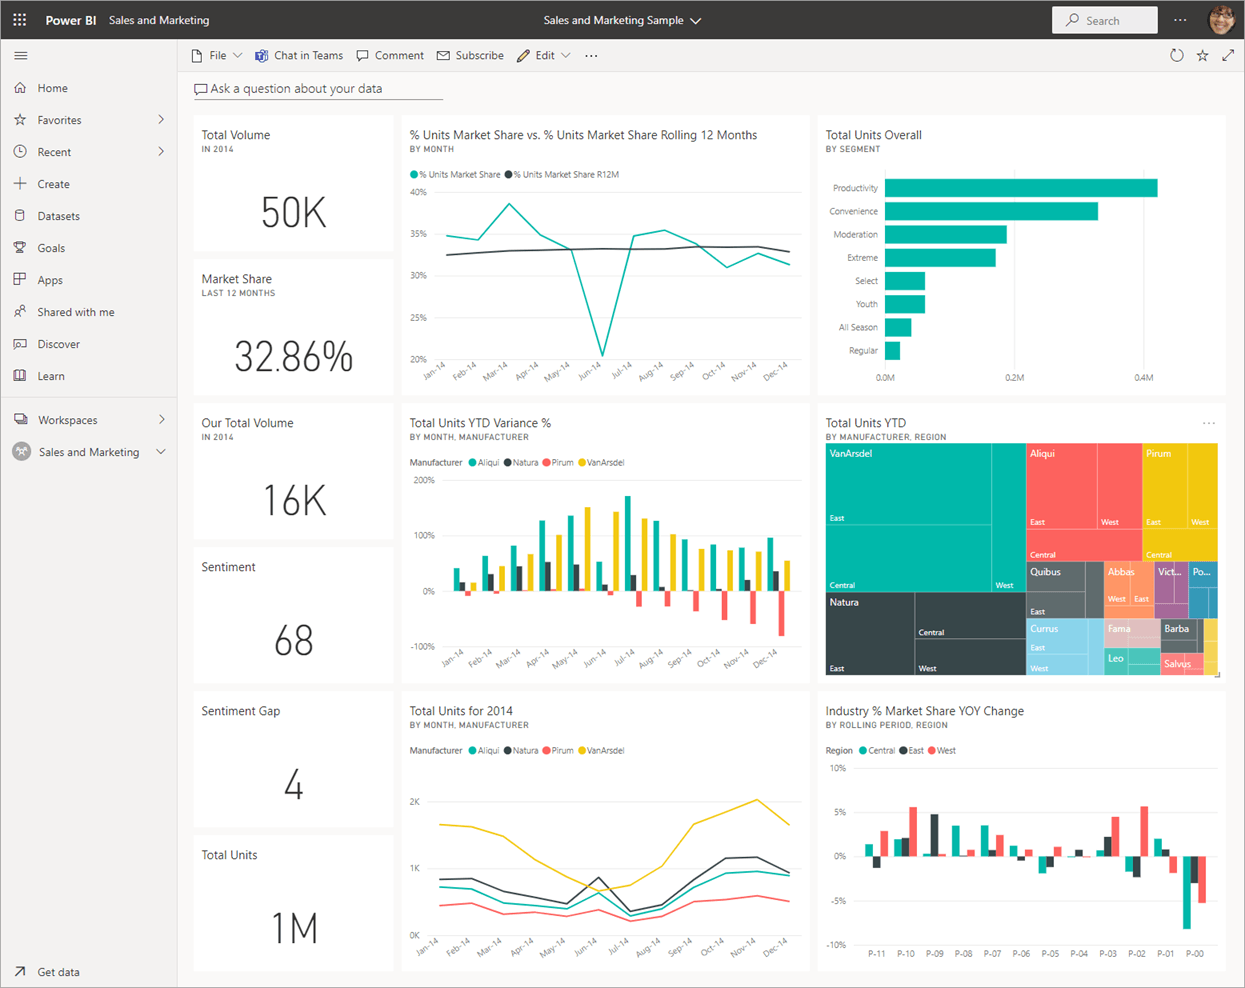
A Power BI dashboard is a collection of visuals.
What is DAX?
DAX stands for Data Analysis Expressions. It is a formula language. You can use DAX to define custom calculations for calculated columns and for measures. DAX includes some of the functions used in Excel formulas, and additional functions designed to work with relational data and perform dynamic aggregation.
DAX is used in:
- Analysis Services
- Power BI
- Power Pivot in Excel
What is the difference between calculated columns & measures?
The main difference between calculated columns and measures is that columns are evaluated at each row, whereas measures are only evaluated at the subdivision level they are plotted at. Columns are calculated each time a data refresh is performed. On the other hand, measures are calculated at each visual interaction which means that unlike measures, column values are not responsive to filter selection or parameters.
Applying fields to visuals
Once measures and calculated columns are ready for usage, you can create a visual. Drag an item from the field tab and drop it in the appropriate section, as shown below.

Want to find out more about how Power BI can help your business goals? Get in touch.
Follow us on