A white background with the words by kagoo written on it

Extract metrics from videos in minutes

Gain actionable insights from AI-driven Power BI analytics, straight from video feeds.

If a human eye can see it, so can Xenial!

Request a demo and FREE POC

Fill in this form and a member of our product team will be in touch to arrange a demo.

93% faster & cheaper to get insights from videos

Xenial is a versatile, no-code, AI-driven video analytics platform that allows businesses to seamlessly extract valuable insights from video streams.


Xenial is 93% faster and cheaper at getting insight from video feeds compared to a traditional data science approach. No need to hire a data scientist or spend weeks setting it up. Your first Machine Learning model can be up and running within a matter of hours, and you don’t require any technical expertise to use it.

Unlock Insights Rapidly with Xenial in 3 Simple Steps

A white background with a few lines on it

Step 1: Connect video

Connect video feed to Xenial. If your human eye can see something in a video, Xenial will be able to see it too!

A black arrow pointing to the right on a white background.

Step 2: ML model

Create ML model by labelling frames. No-code, no tech skills required! Set up your first model within minutes.

A line drawing of a graph on a white background.

Step 3: Analytics

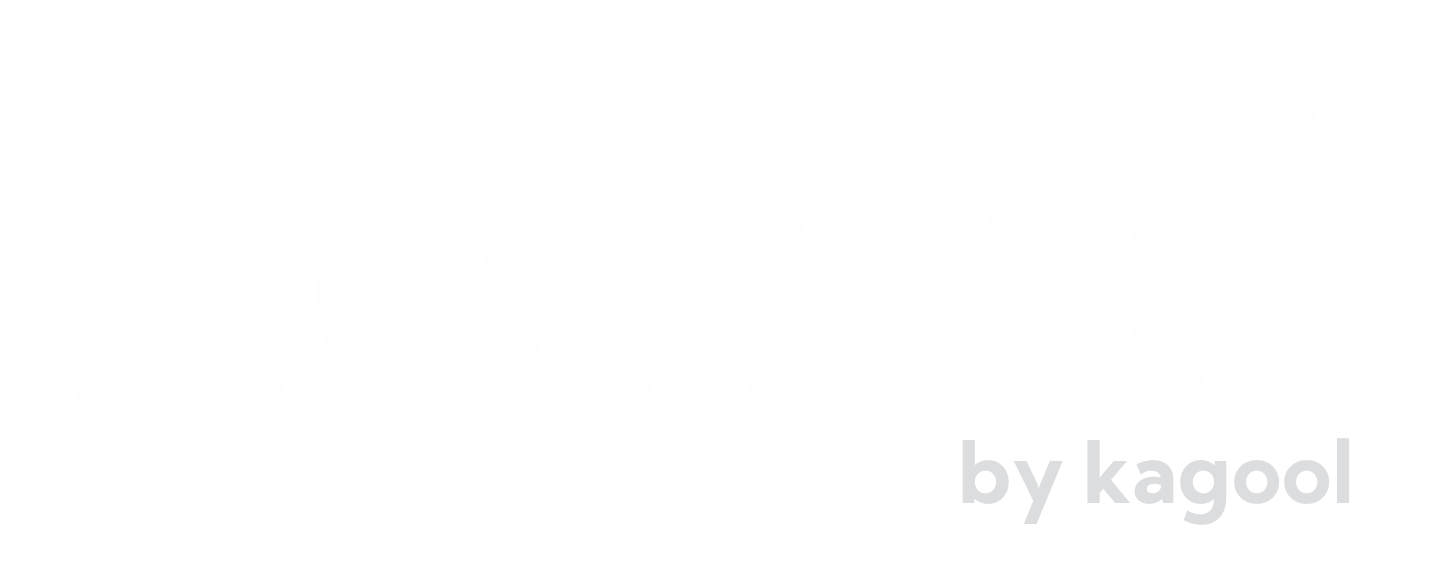
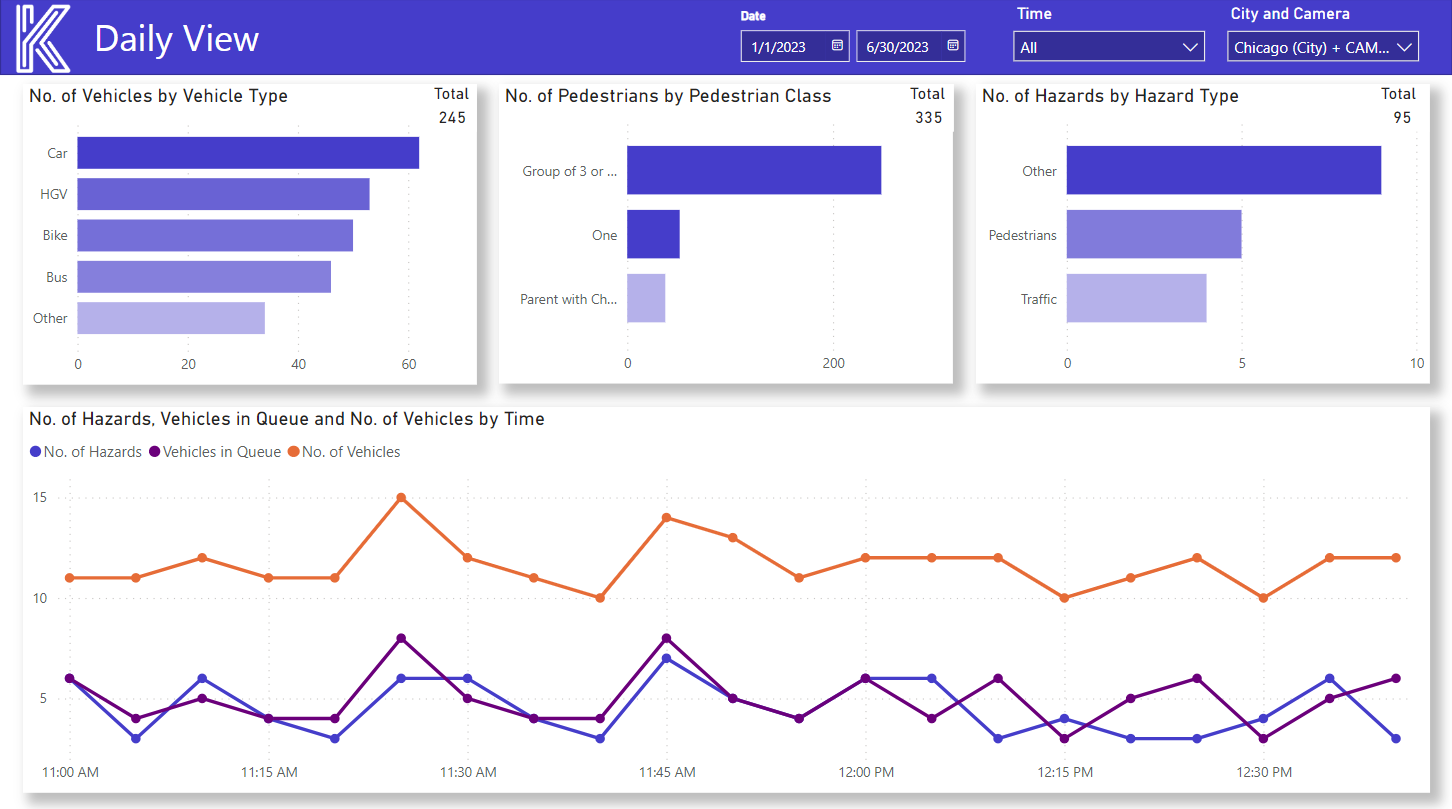
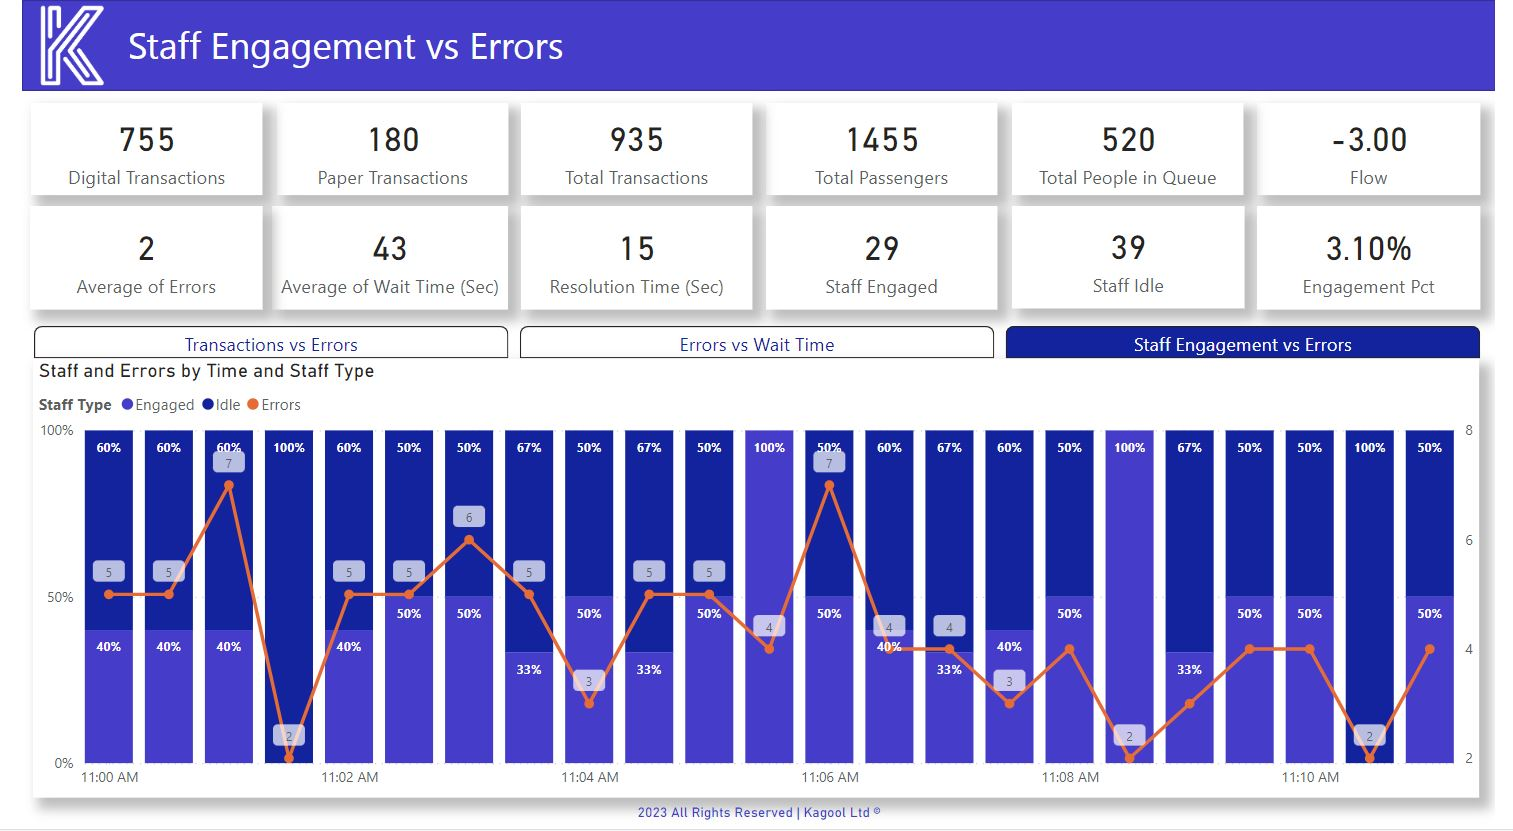
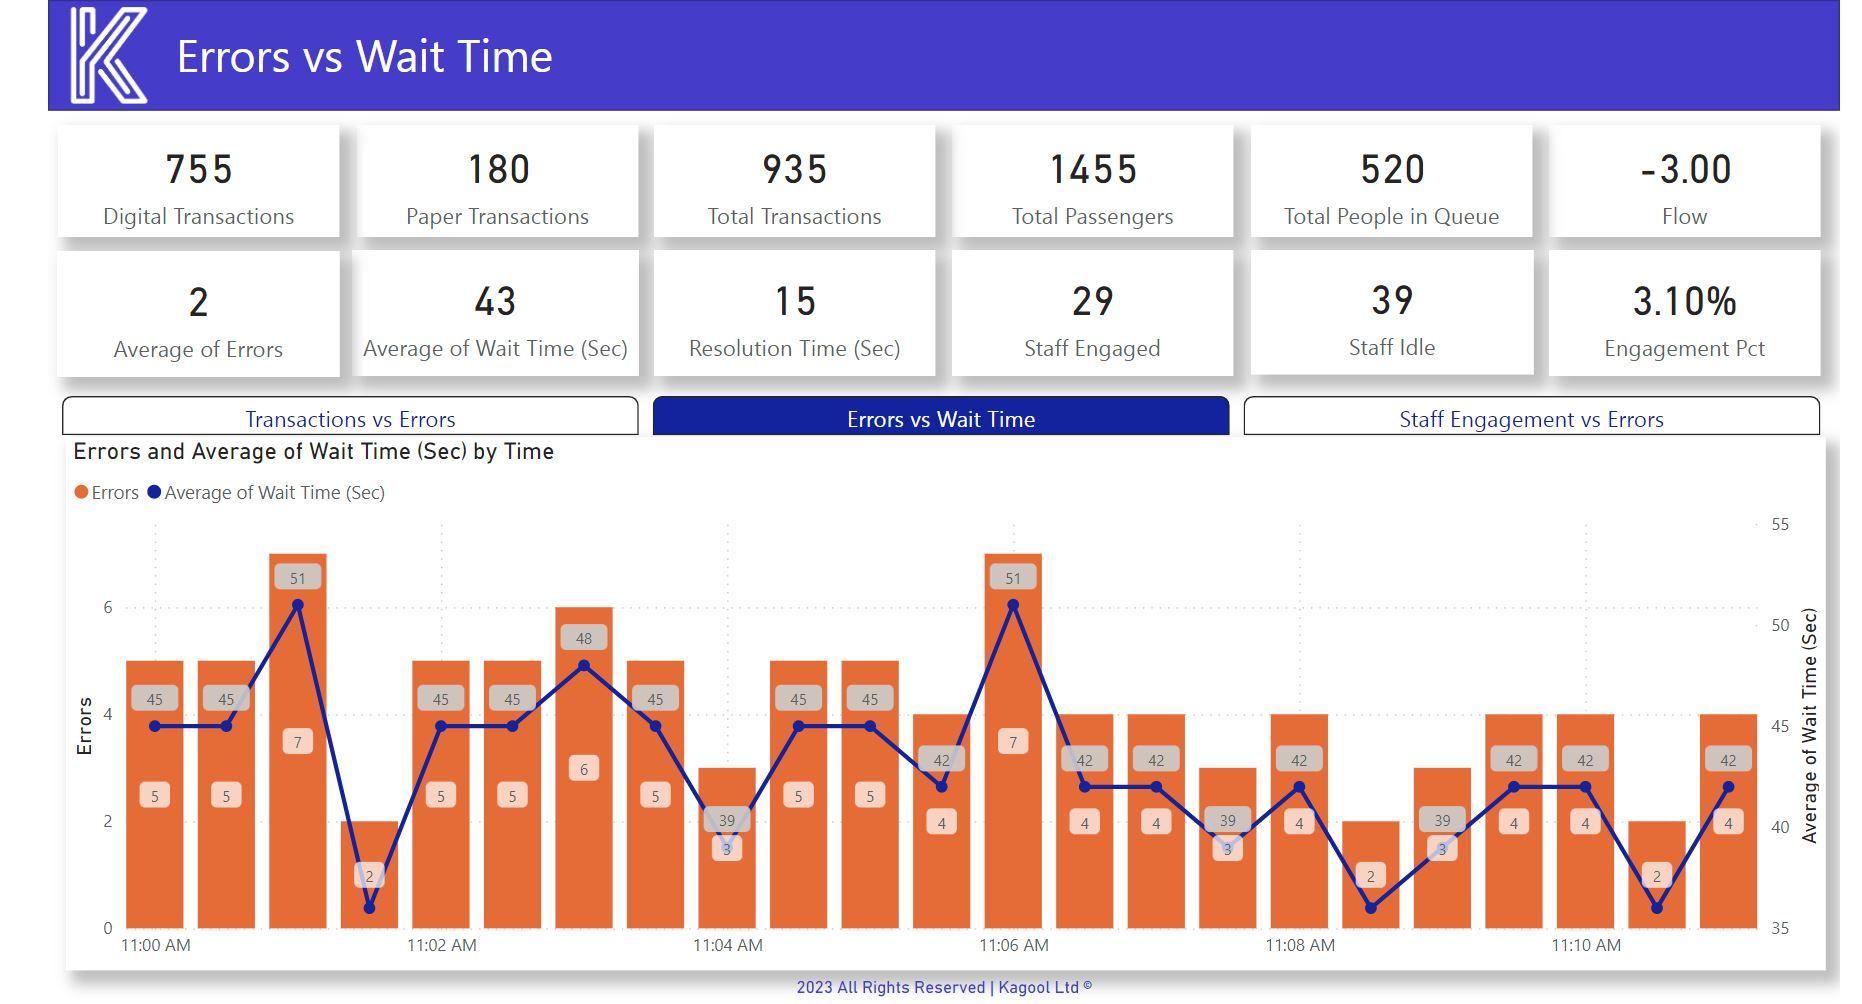
Generate an interactive, intuitive Power BI analytics report, giving you actionable insights.

Xenial is an Azure based SaaS solution that is accessible via an app we have customised on Azure app services.

  • A collage of graphs and a picture of a highway

    Slide title

    Write your caption here
    Button
  • A dashboard showing a daily view of various graphs

    Slide title

    Write your caption here
    Button

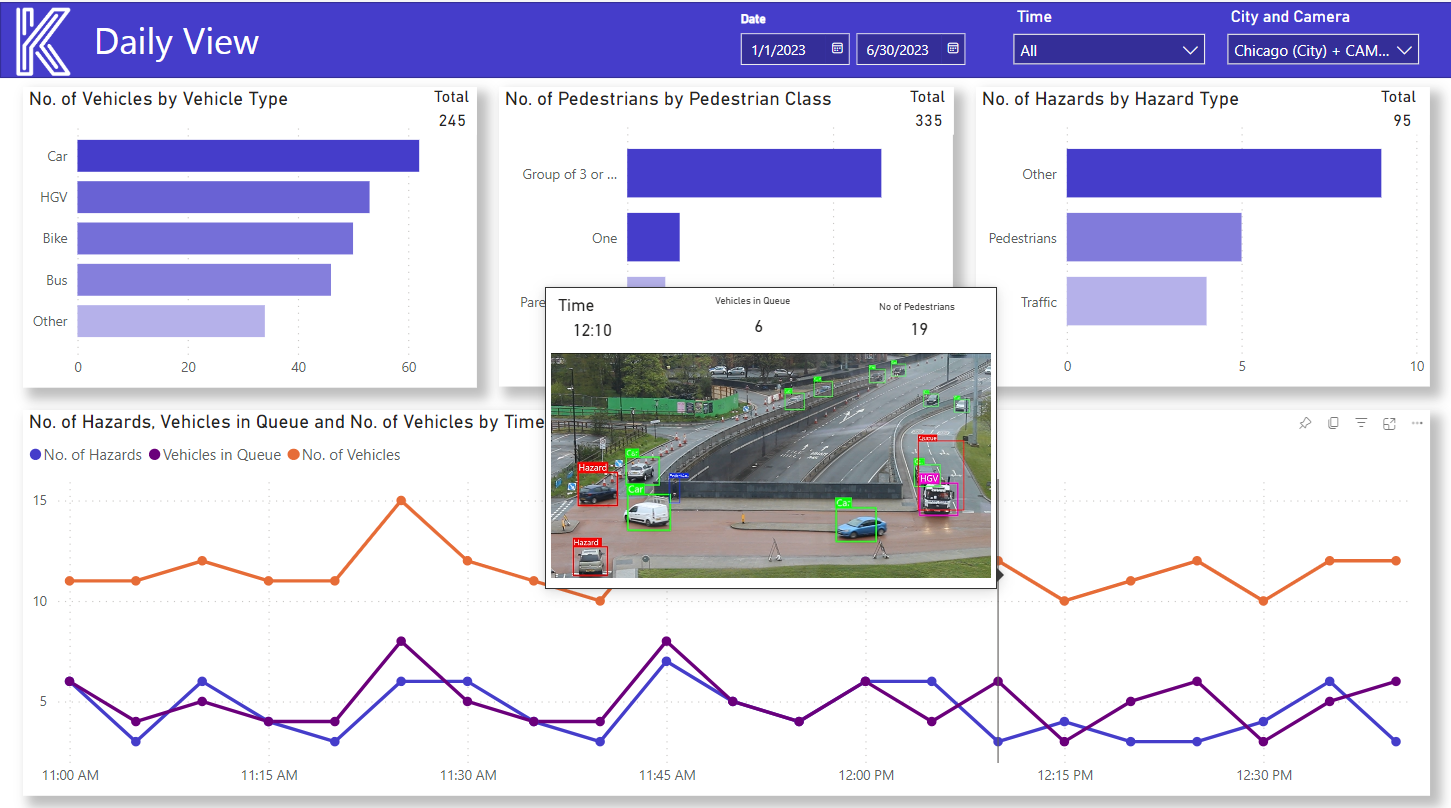
Road traffic monitoring

  • A dashboard showing the number of transactions vs errors

    Slide title

    Write your caption here
    Button
  • A dashboard showing staff engagement and errors

    Slide title

    Write your caption here
    Button
  • A dashboard with a graph showing errors vs wait time

    Slide title

    Write your caption here
    Button

Ticket barrier cameras

  • A computer screen shows a map of the united states

    Slide title

    Write your caption here
    Button
  • A dashboard with a bunch of graphs on it

    Slide title

    Write your caption here
    Button
  • A computer screen shows a picture of a person behind a fence.

    Slide title

    Write your caption here
    Button

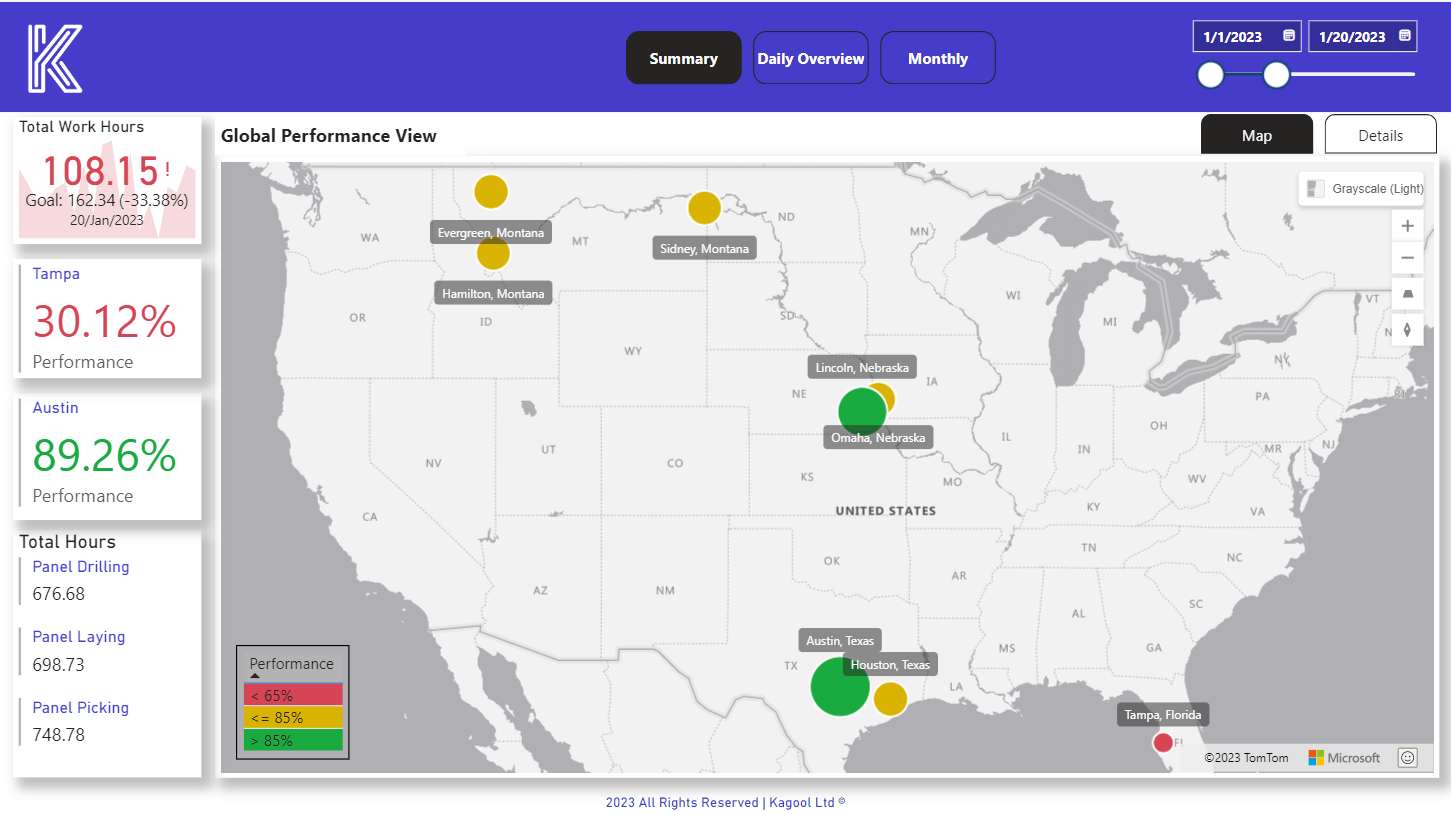
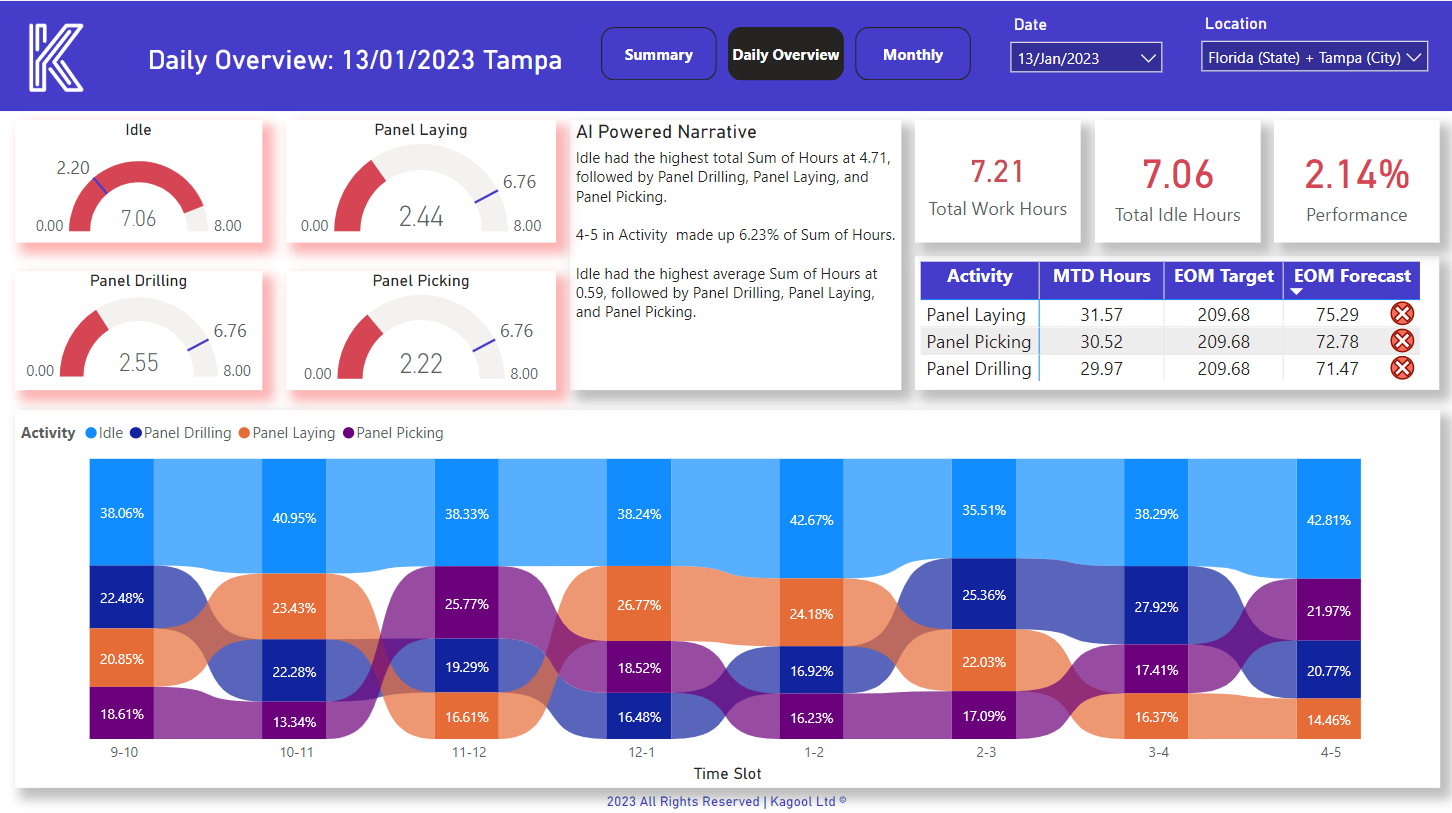
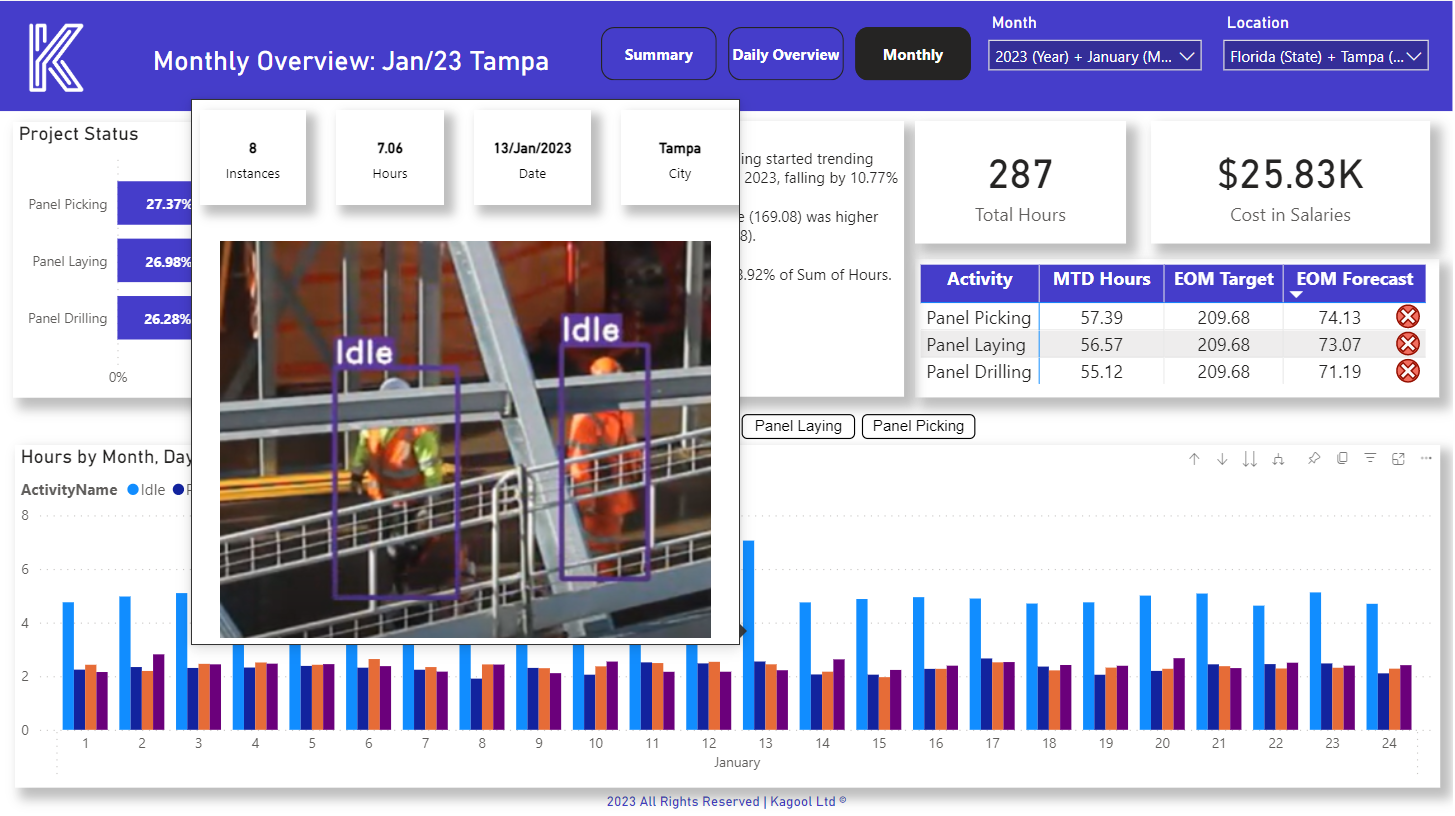
Construction - safety & productivity

  • Retail Power BI report
    Write your caption here
    Button
  • A computer screen shows a floor plan of a building

    Slide title

    Write your caption here
    Button

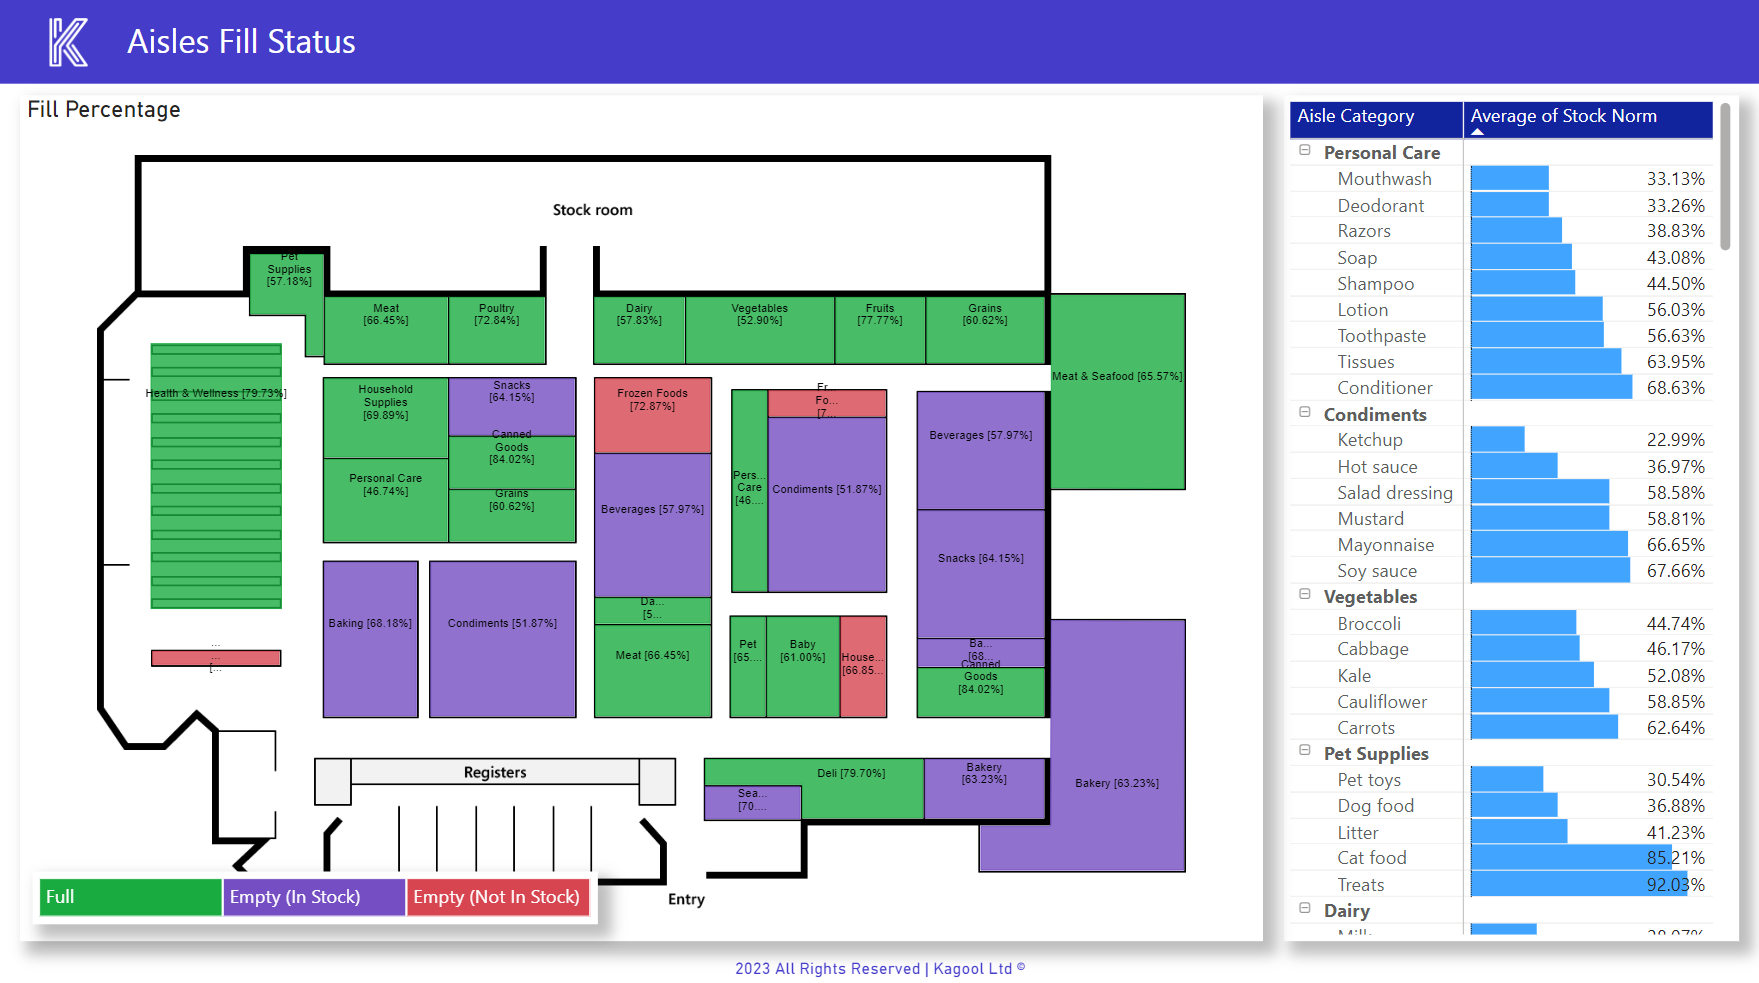
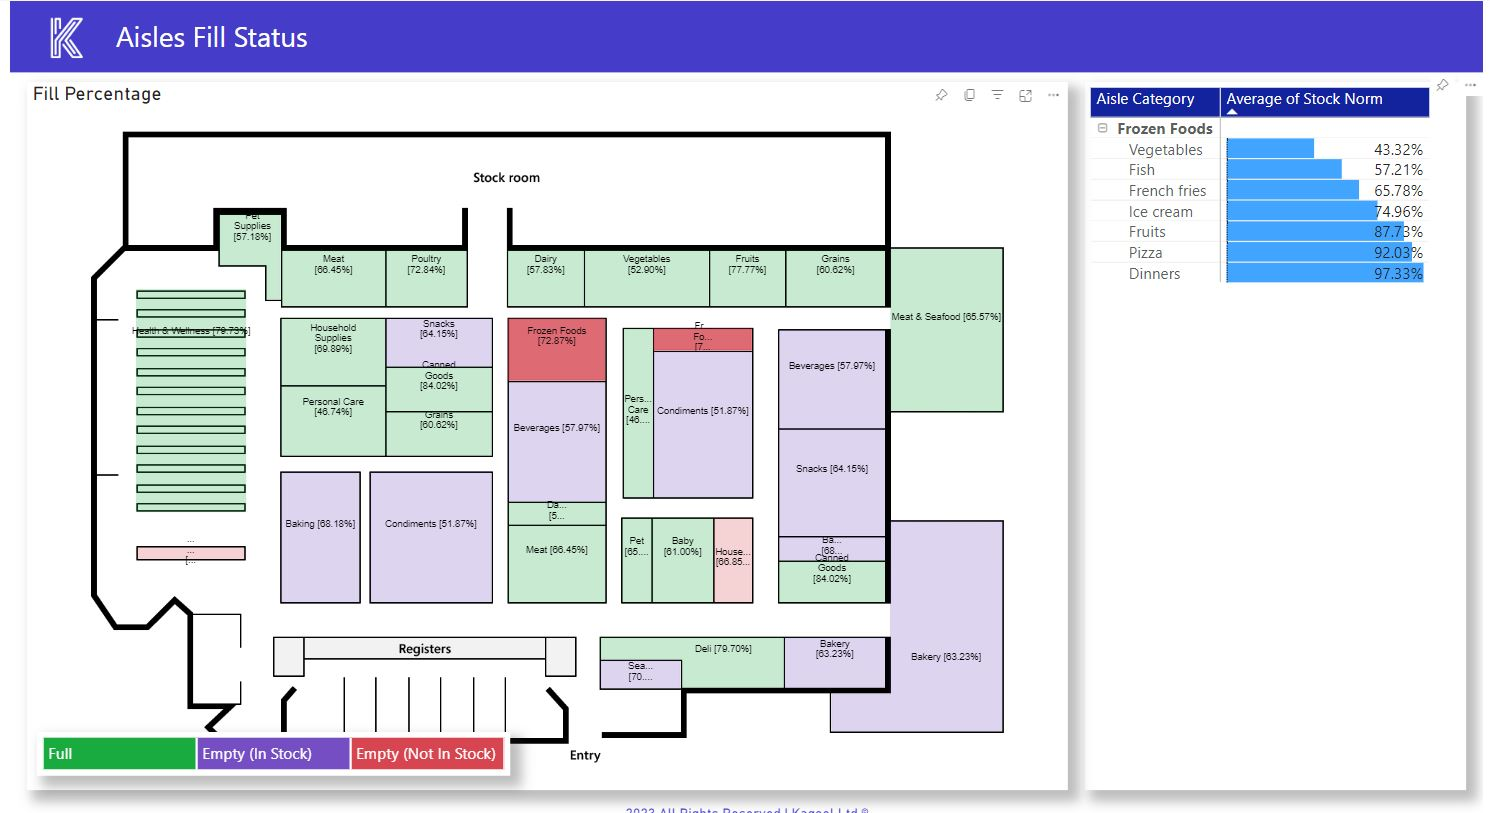
Retail - stock level

  • Retail Power BI report
    Write your caption here
    Button
  • A computer screen shows a street view and a map

    Slide title

    Write your caption here
    Button

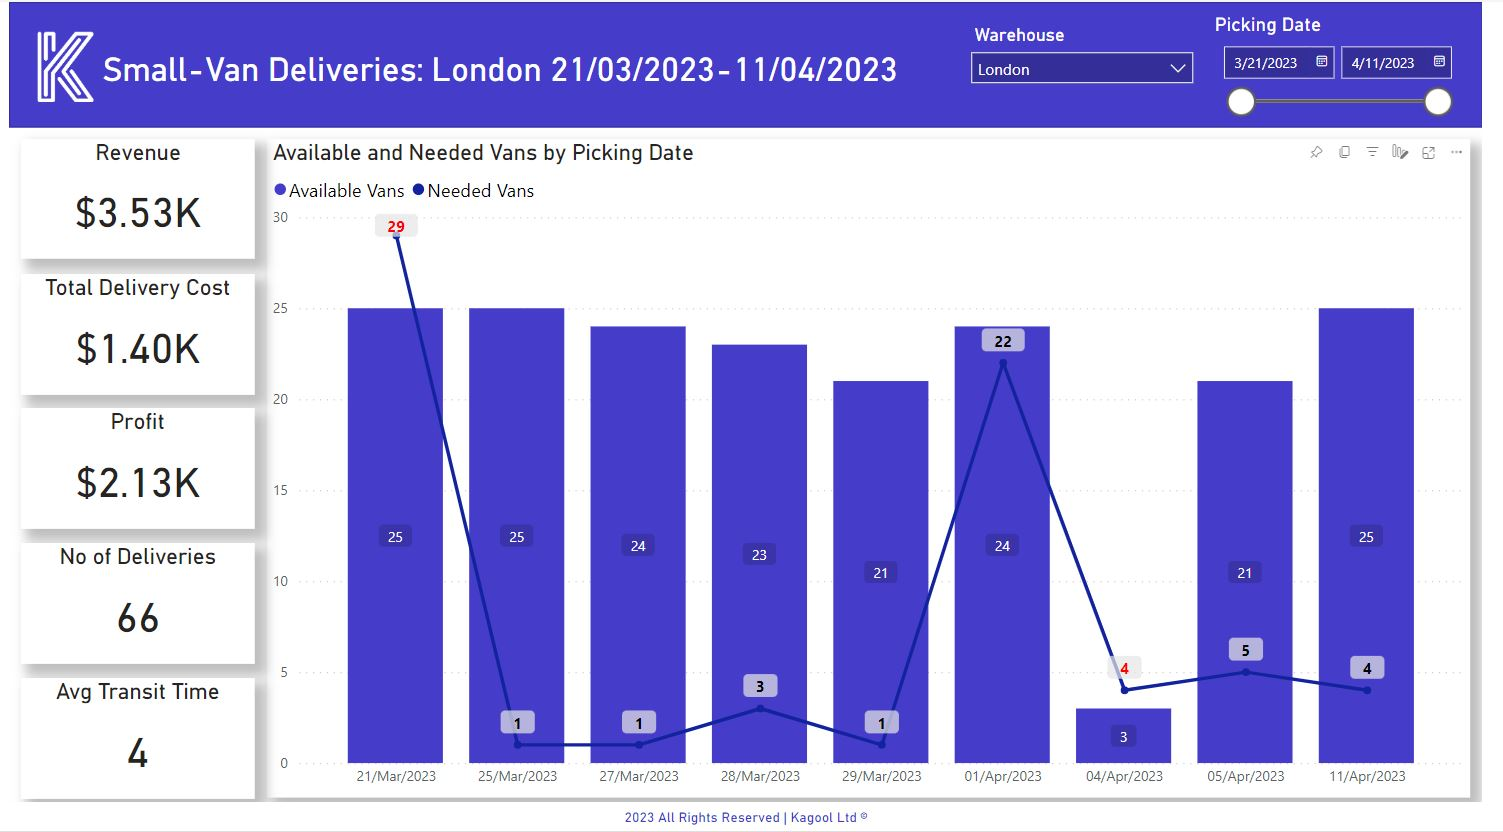
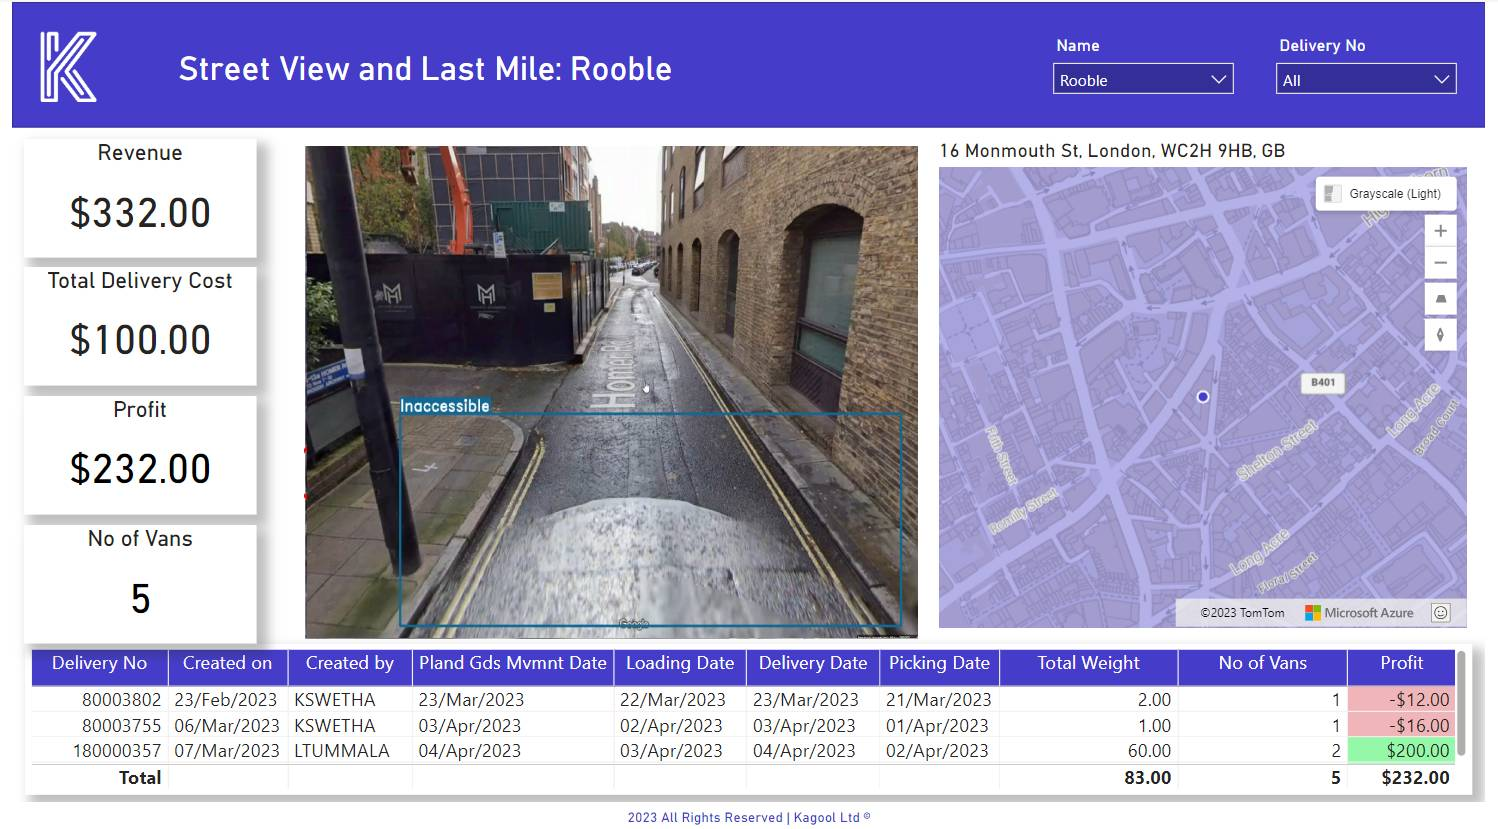
Transport & Logistics - road accessibility

Xenial is constantly expanding to more domains...

Sports

Ticket Queue Management 

A white background with a few lines on it

No code approach

Any new user can set up and start using Xenial within 30 minutes - no data coding required.

A black and white drawing of a wrench and screwdriver on a white background.

Customisable

Xenial adapts to your business requirements with ease.

A white background with a few lines on it

User friendly

Just upload, label, and inference your video. Our intuitive UI makes it a breeze.

A white background with a few lines on it

SaaS solution

Managed by Kagool, freeing up your business stakeholders to focus on insights and decisions.

Ready to transform Your Business with Xenial? Let's Chat!

Request A Xenial Demo

Request a demo

Fill in this form and a member of our product team will be in touch to arrange a demo.

Share by: